Sectional Times in Greyhound Racing — What Split Data Reveals About True Ability
A finishing time tells you who won and how fast. It does not tell you why. Sectional times in greyhound racing break a single race into segments — the run to the first bend, the middle section, the run home — and in doing so they expose dynamics that the final clock hides completely. Two dogs can post identical finishing times and have run entirely different races: one blazing early and hanging on, the other slow to find stride but finishing like a train. The race inside the race is where genuine insight lives, and sectional data is the tool that reveals it.
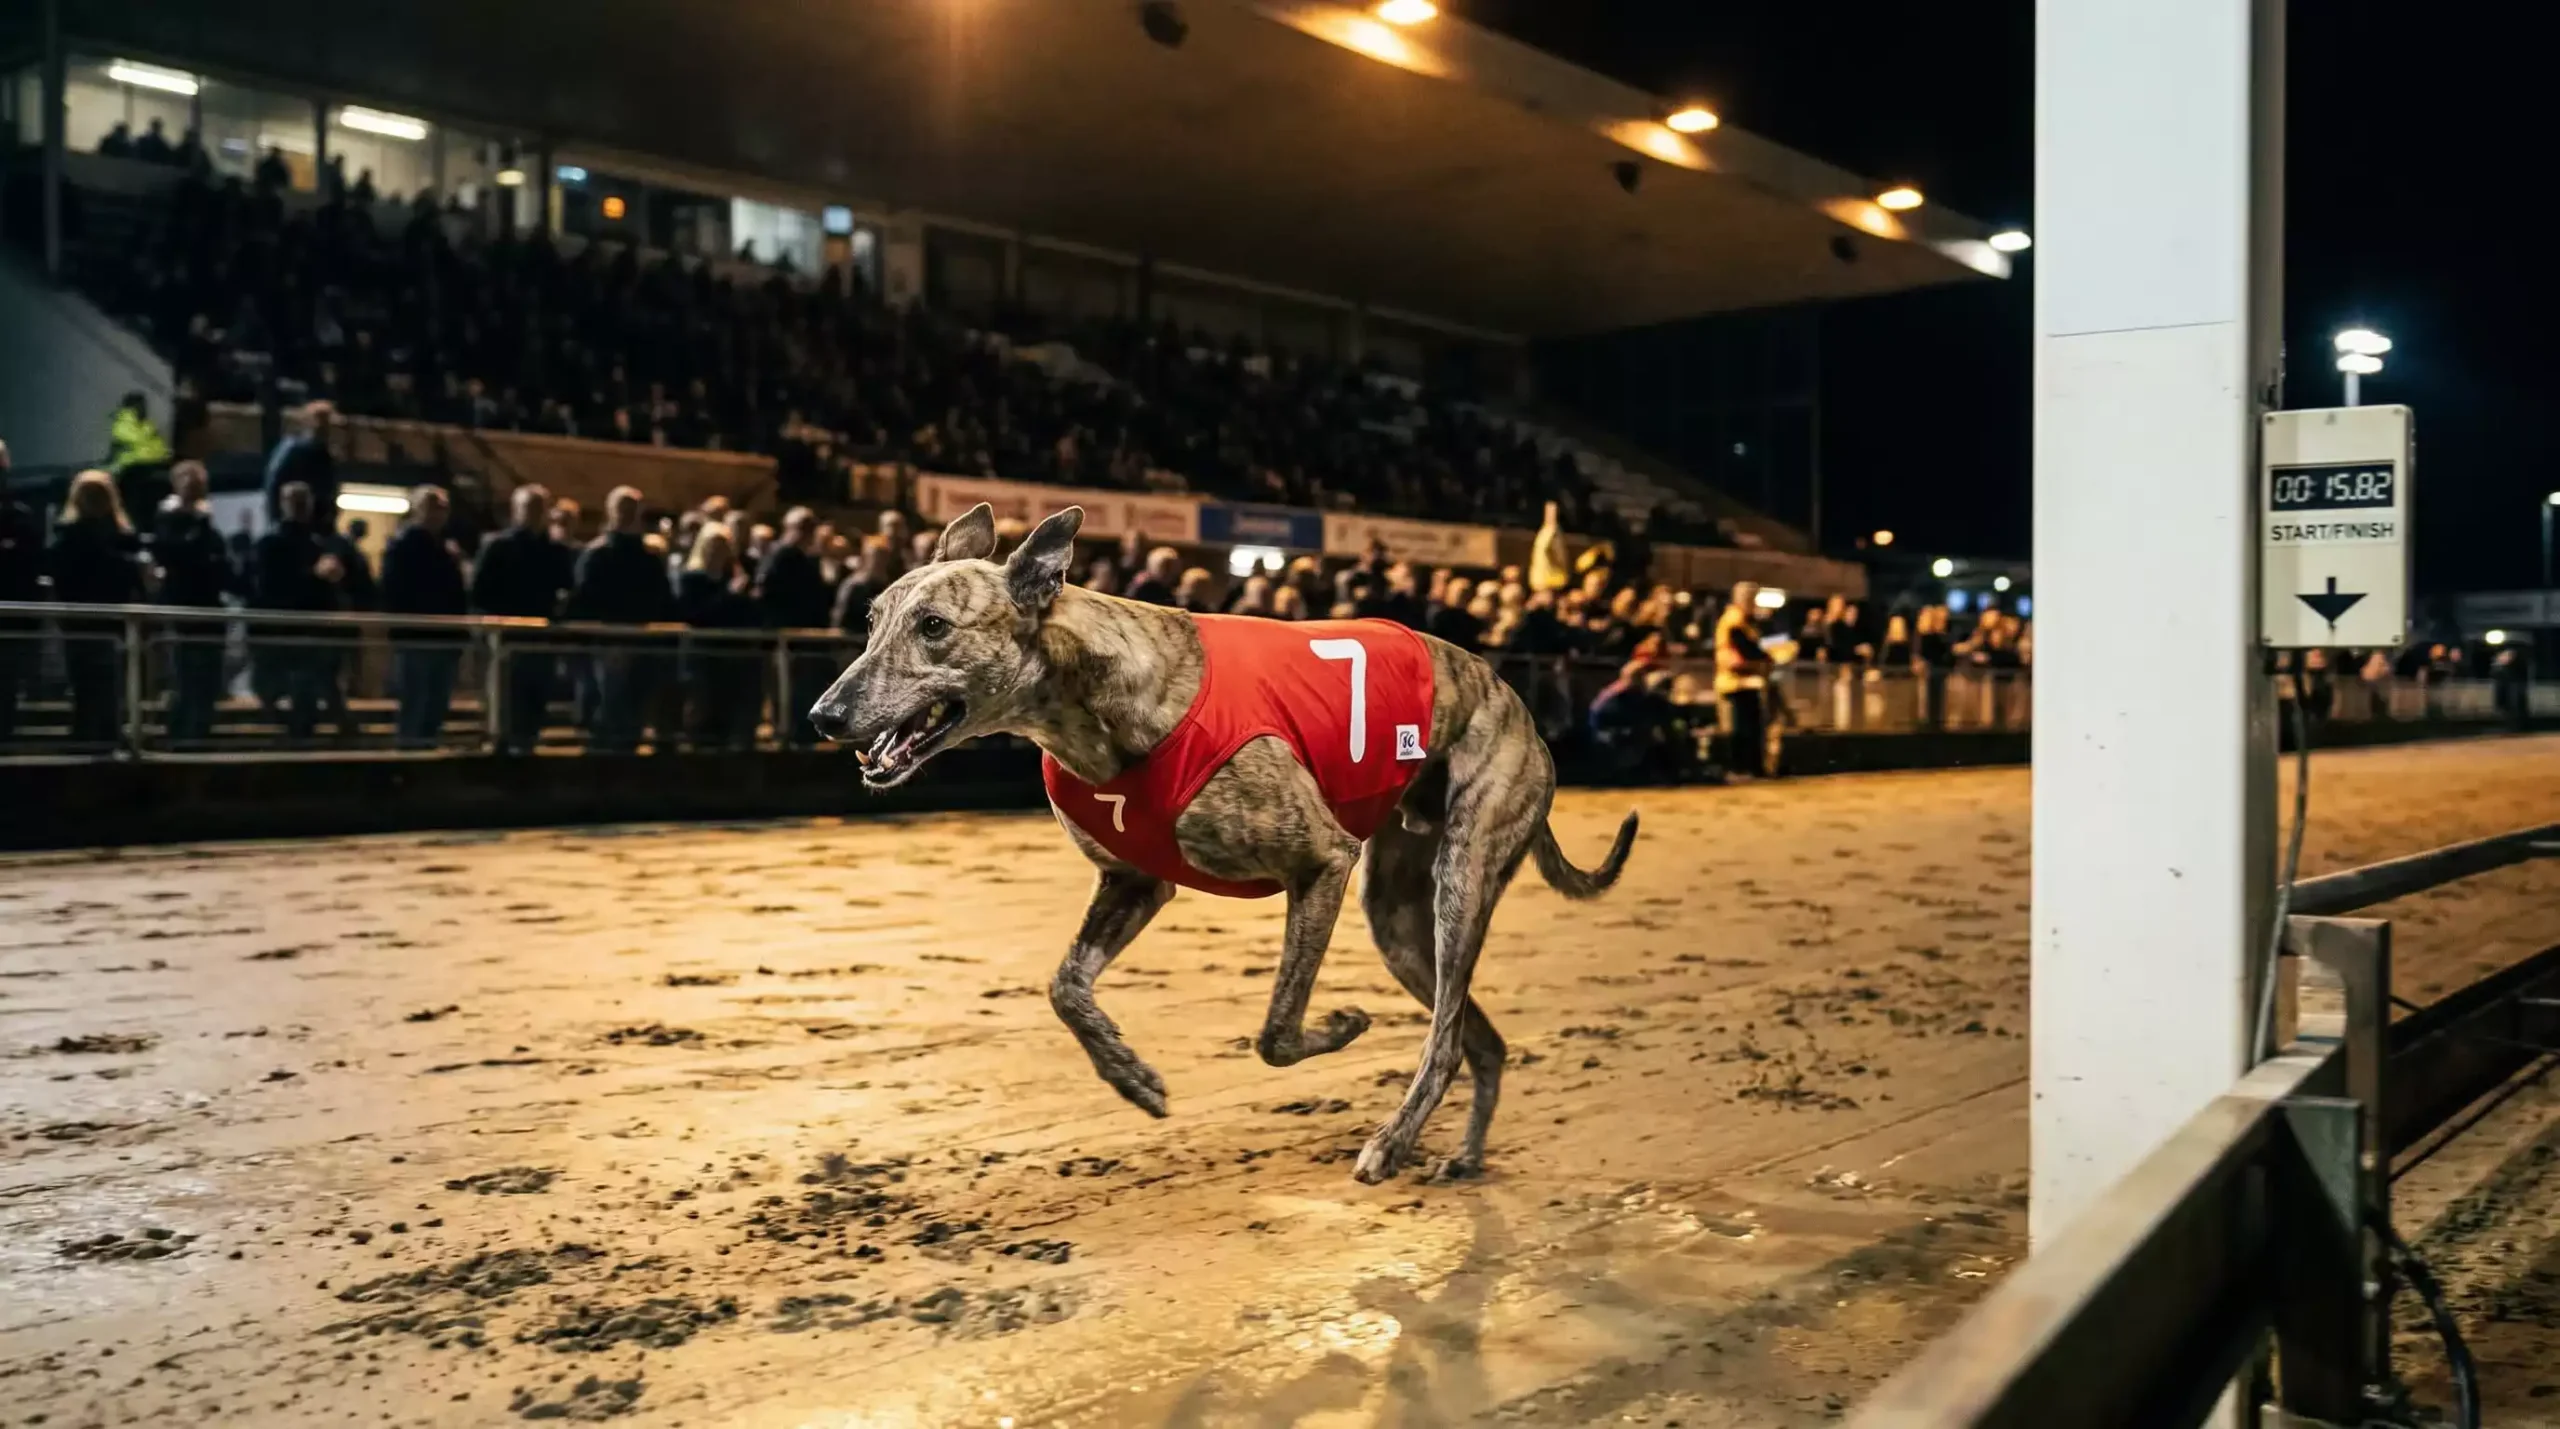
For anyone serious about form analysis, yarmouth greyhound sectional times are particularly revealing. The circuit at Caister-on-Sea is tight enough that positional advantage through the bends compounds quickly, which makes the first-bend split one of the most telling numbers on the card. A dog that reaches the first turn in front — without excessive crowding — is significantly more likely to hold position through the remaining bends, because the rail line is the shortest path around a 382-metre loop. Sectional data puts a number on that advantage, turning a vague impression into something measurable.
This guide explains how sectional times are captured, what each split covers, and how to apply the data when comparing dogs with similar overall times but very different running profiles. It is not abstract theory — it is the difference between two dogs that look identical on paper and the one that actually deserves your money.
How Sectional Times Are Recorded
Sectional timing in greyhound racing relies on a combination of photo-finish technology and electronic timing gates positioned at fixed points around the track. The standard setup uses beam-break sensors — placed at the start line, at one or more intermediate points and at the finish — to record the precise moment each dog crosses. The system captures data to hundredths of a second, and the splits are typically published alongside the full result within minutes of the race finishing.
At Yarmouth, where the standard race distance is 462 metres over four bends, the sectional breakdown usually covers two key segments: the time to the first timing point (roughly the first bend or the halfway mark, depending on the provider) and the run-home section from the final timing point to the finish line. Some data services offer a more granular breakdown, splitting the race into three or four sections, but even the basic two-split format is enough to distinguish early-pace runners from closers.
The technology itself is mature and reliable. Photo-finish cameras have been standard at licensed tracks for decades, and the addition of sectional timing gates has been driven largely by demand from betting operators and data providers who sell analytical products. Not all tracks publish sectional data with the same granularity, and third-party services like Timeform and GreyhoundStats often provide the most complete datasets. The raw numbers are public; the interpretation is where the value lies.
One practical note: sectional times are affected by the same variables that influence overall times — track condition, weather, hare speed. A fast first-bend split on a dry evening in July is not directly comparable to the same split on a wet November night. The numbers need context, and comparing sectionals across meetings without adjusting for conditions will lead to flawed conclusions. Within a single race, however, the splits are perfectly comparable, because every dog in the field faces identical conditions.
Early Pace and First-Bend Dynamics
The first-bend split is arguably the most important number in greyhound race analysis. On a tight circuit like Yarmouth’s 382-metre loop, the dog that leads through the first bend controls the rail line and forces rivals to cover extra ground on every subsequent turn. According to the Scottish Animal Welfare Commission, the average racing greyhound reaches approximately 65 km/h on track. At that velocity, a dog on the outside of a bend covers measurably more distance than the one hugging the rail — even a fraction of a second lost per bend adds up over a four-bend race.
Early pace is partly innate — some dogs are naturally quick out of the traps — and partly positional. Trap draw affects which dogs have the shortest run to the first bend, and the hare system influences sightlines during the initial sprint. At Yarmouth, the Swaffham outside hare means dogs are looking outward as they leave the boxes, which can benefit wider-drawn runners who do not need to adjust their line to find the lure. A fast first split from trap six under an outside-hare system tells you something different from the same split at a track with an inside hare.
Where early pace becomes analytically powerful is in explaining results that the finishing time alone makes confusing. Consider two dogs that both finish in 29.20 seconds over 462 metres. Dog A ran 4.10 to the first bend and 25.10 for the rest. Dog B ran 4.40 to the bend and 24.80 for the rest. Dog A led from the start and controlled the race; Dog B was slow away, bumped through the first bend, and still closed the gap to finish on the same time. The finishing clock says they are equal. The sectionals say Dog B is the better animal on raw ability, and if it draws a trap that gives it a cleaner first bend next time, the outcome could be very different.
Trainers know this, which is why you will sometimes see a dog switched from an inside trap — where it consistently gets crowded at the first bend — to an outside box for its next run. The sectional data makes the trainer’s logic transparent. A dog with slow first-bend splits from inside traps but fast run-home times is not losing form; it is losing position, and a trap switch could be the fix.
Mid-Race Splits and Run-Home Time
If the first-bend split tells you who controlled the early running, the mid-race and run-home sections reveal who was still travelling at the end. The run-home time — the split from the final timing point to the finish line — is widely regarded as the purest measure of a greyhound’s sustained speed. By this stage the field has spread, interference is minimal and each dog is running on its own merits. A fast run-home split indicates a dog with genuine stamina reserves, the kind that will overhaul fading leaders in a stronger grade.
Mid-race splits, where available, capture the section between the first and last timing points. This is often the phase where tactical races are won and lost. A dog that sits second or third through the middle section without expending energy trying to overtake is conserving speed for the run home. A dog that moves wide to challenge around the third bend is spending effort that may not pay off. The numbers do not tell you why a dog ran a particular split — interference, crowding, hare position all play a part — but they do tell you how much speed was available at each stage, and that is enough to work with.
Run-home data is especially valuable when comparing dogs across different grades. A dog finishing fourth in an A3 race with a run-home split of 9.80 seconds may be more talented than a dog winning an A6 race with a run-home of 10.30. The finishing positions suggest the opposite, but the split tells a clearer story: the A3 dog was still accelerating when the A6 winner was already slowing. This kind of cross-grade comparison is one of the most practical applications of sectional data, and it is available to anyone willing to look beyond the result column.
There is a caveat. A very fast run-home split sometimes indicates a dog that was badly baulked early and simply had more ground to make up. In that scenario the speed is real, but the context matters — the dog may have been running in clear air while the leaders were checking each other. Sectionals illuminate; they do not dictate. They are one input among several, and the best analysts use them to ask better questions rather than to leap to conclusions.
Using Sectional Data for Better Selections
The practical application of sectional data comes down to one question: does this dog’s split profile suit today’s race? A dog with consistently fast first-bend times drawn in trap one at a track with an inside-rail bias is a strong candidate to lead. A dog with moderate early pace but exceptional run-home splits might struggle at 277 metres — where the race is over before its stamina kicks in — yet thrive over 659 metres where the extra bends allow closers to reel in front-runners.
The most productive habit is to compare two or three dogs in the same race using their most recent sectionals. Line up the first-bend splits and the run-home times side by side. If one dog is quicker early and another is quicker late, the race shape becomes predictable: the early-speed dog needs to build a lead through the first two bends; the closer needs a clean run without interference to deliver its finish. The trap draw often determines which scenario is more likely, and that is where the racecard and the sectional data intersect.
Over time, building a personal database of sectional splits — even a simple spreadsheet — creates a baseline for each dog at a given track and distance. Deviations from that baseline signal either improvement, decline or a change in conditions. A dog that normally runs 4.20 to the first bend but clocked 4.35 last time may have been slow out of the traps, bumped at the break or simply fatiguing. Check the conditions and the draw before assuming the worst. The numbers are diagnostic, not conclusive, and the best use of them is to narrow the field of possibilities before the race rather than to explain results after it.