Trap Bias Explained — Why Certain Traps Win More at Any Greyhound Track
Greyhound trap bias is not superstition and it is not random. It is geometry. Every licensed track in the country has a measurable tendency for certain traps to produce more winners than others, and the reasons are rooted in the physical shape of the circuit, the position of the hare and the distance from each starting box to the first bend. Dismiss it as noise and you are ignoring one of the most quantifiable edges available to anyone studying a racecard.
The concept is straightforward: if trap one sits closest to the inside rail and the first bend curves to the left, the dog in trap one has the shortest path to the rail line. The dog in trap six has the longest. Over hundreds of races, that positional difference produces a statistical skew — not huge, not guaranteed, but persistent and measurable. Multiply that skew across every race on a card and you start to understand why serious bettors treat trap statistics as a core input rather than a curiosity.
This guide explains the mechanics behind trap bias, compares how different hare systems alter the expected patterns, shows how bias shifts across distances and addresses the limitations of the data. The aim is not to hand you a shortcut — geometry, not luck, determines which traps win most — but to give you the framework to interpret trap statistics at any track with confidence.
The Physics of Trap Bias — Bends, Hare Position and Track Width
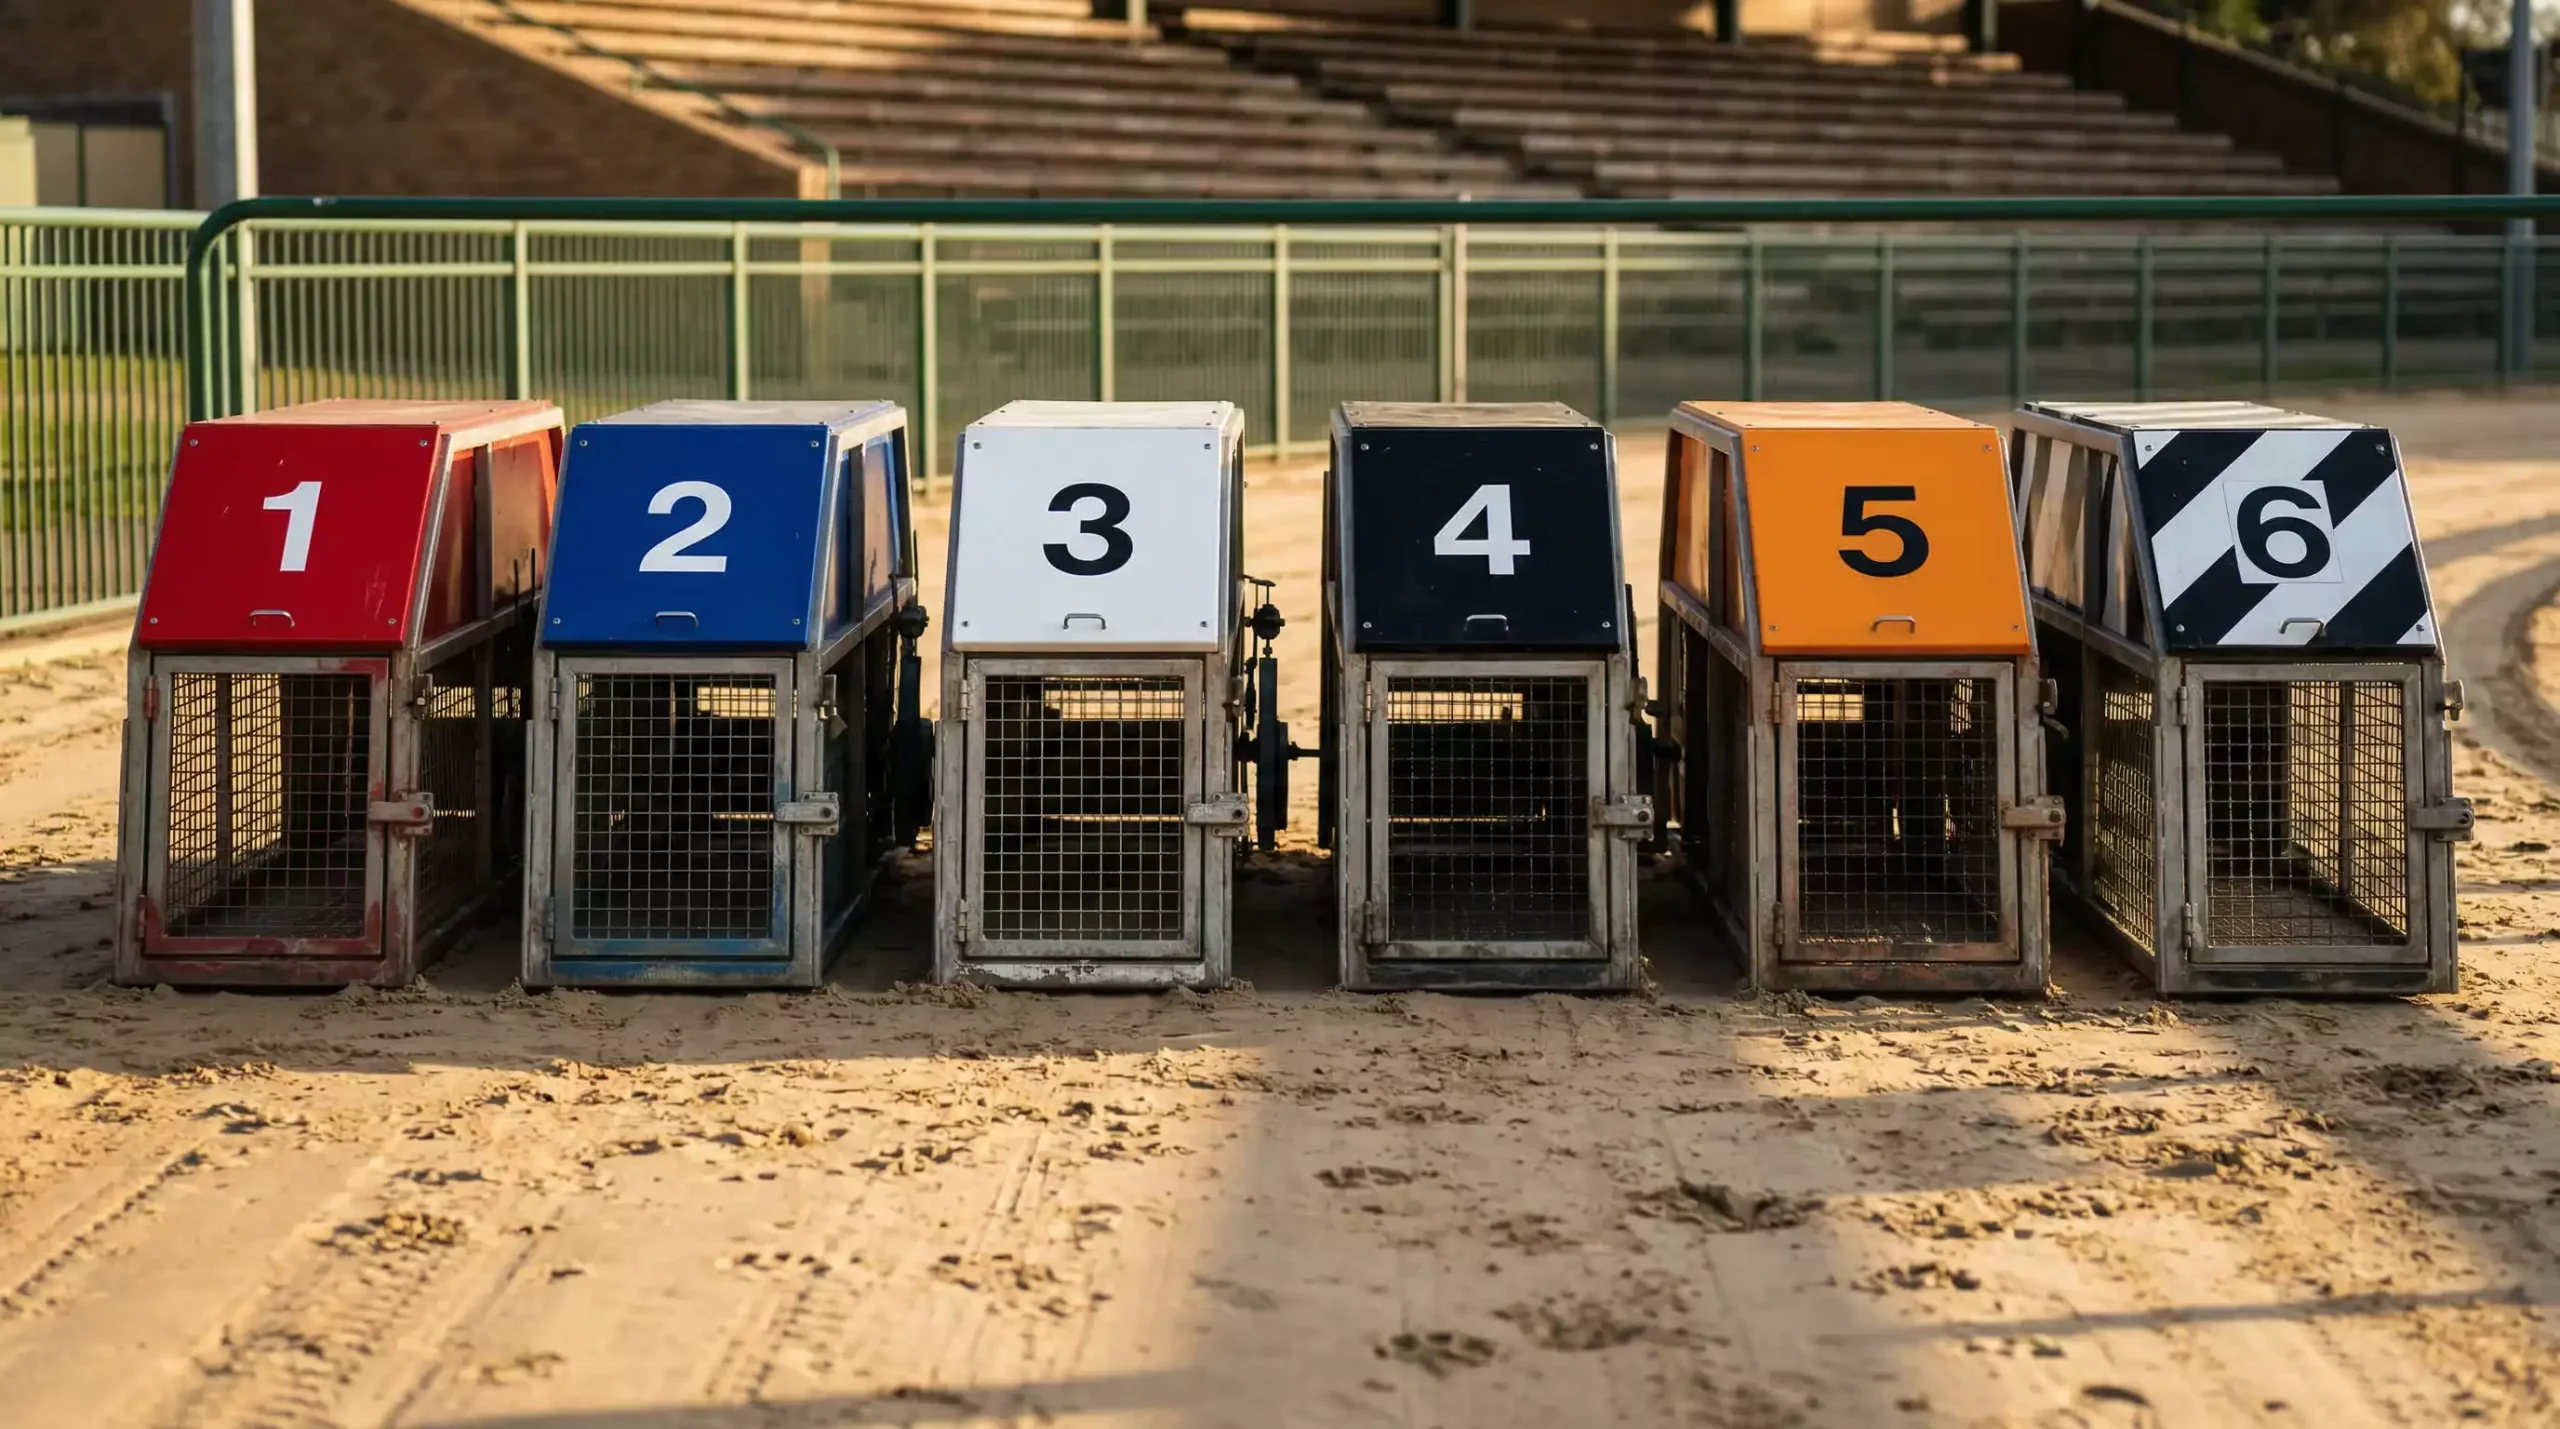
Trap bias begins with the layout of the starting boxes relative to the first bend. In a standard six-trap setup, the boxes are positioned in a line across the track, with trap one on the inside and trap six on the outside. When the lids fly open, all six dogs accelerate toward the same corner. The dog in trap one has the geometry in its favour: it is already closest to the rail and needs to cover the least ground to reach the inside line through the turn. The dog in trap six must either cross the entire field to get to the rail or accept running a wider line, which means covering more ground on every subsequent bend.
At Yarmouth, the circuit measures 382 metres in circumference with a Swaffham outside hare. The tight circumference amplifies the effect of bends, because the turn radius is sharper than at a larger track. On a sharp bend, the distance differential between the rail and the outside line is greater per turn, which means the positional advantage of leading into the bend compounds more aggressively. Over four bends at 462 metres, a dog running consistently wide can cover several metres more than the rail runner — an invisible handicap that does not appear in the finishing time but absolutely influences the result.
Track width is the third variable. A wider track gives outside runners more room to find their stride without crowding, but it also means the rail line is proportionally more valuable because the distance saved on the inside increases with track width. A narrow track compresses the field through the bends, which can neutralise some of the inside advantage because crowding and interference become more likely. Yarmouth’s track dimensions create a balance where inside traps benefit from the geometry but can suffer from first-bend congestion when multiple early-pace dogs are drawn low.
The hare position modifies all of this. The lure is the focal point for every dog leaving the boxes, and its position — inside the rail, outside the rail or on the rail itself — determines the initial trajectory of the field. The interaction between hare position and trap draw is the single biggest determinant of trap bias at any given track, which is why understanding the hare system is essential before interpreting any trap statistics.
Inside vs Outside Hare — The Key Variable
The difference between an inside hare and an outside hare is not cosmetic — it fundamentally reshapes the expected trap bias at a track. An inside hare runs on the inner rail, which means dogs in the lower traps (one and two) have the clearest sightline to the lure as they leave the boxes. They naturally angle inward toward the rail, taking the shortest path to the first bend. Outside traps, by contrast, must look across the field to see the hare and often lose a fraction of a second adjusting their line. The result at inside-hare tracks is a consistent statistical advantage for low-numbered traps, particularly over sprint distances.
An outside hare — the system used at Yarmouth with the Swaffham model — reverses parts of this dynamic. The lure runs outside the rail, which means dogs in the higher traps (five and six) have the most direct sightline as they break. Rather than cutting across to find the rail, they can run a straighter initial line toward the hare, and this cleaner run to the first bend can offset or even neutralise the geometric advantage of the inside boxes. The overall bias pattern at an outside-hare track is typically flatter: the gap between the best and worst traps is smaller than at an inside-hare venue.
Consider the contrast between a track using an outside hare — like Yarmouth — and one that historically used an inside system. At inside-hare venues, trap one typically dominates sprint distances because the dog has both the geometry and the sightline working in its favour. At Yarmouth, trap one still benefits from the shortest path to the rail, but the outside hare gives the wider-drawn dogs a sightline advantage that partially compensates. The net effect is a more evenly distributed trap bias at outside-hare tracks, which makes venues like Yarmouth ones where outsiders drawn in traps five and six are less disadvantaged than the same dogs would be under an inside-hare system.
This comparison matters for anyone betting across multiple tracks. A dog that consistently wins from trap one at an inside-hare venue is not automatically the same proposition when it moves to Yarmouth and draws the same box. The hare system changes the race shape from the first stride, and the trap statistics at each track reflect that difference. Transferring bias assumptions between tracks without checking the hare type is one of the most common analytical errors in greyhound betting.
Distance Matters — How Bias Changes Across Trips
Trap bias is not fixed across distances — it shifts, sometimes dramatically, as the number of bends increases. Over a two-bend sprint at 277 metres, the first bend is everything. The dog that reaches it in front usually wins, and because there is only one more turn before the finish, there is almost no opportunity for a poorly drawn dog to recover. Sprint bias tends to be the sharpest and most consistent on any track’s data sheet.
At the standard 462-metre distance, the bias is still present but more moderate. Four bends create more opportunities for the field to reshuffle. A dog drawn in trap six that loses position at the first bend can pick up the rail through the back straight if the leaders drift wide on the second turn, and two more bends remain for that repositioning to pay off. The data at 462 metres generally shows a less extreme spread between the highest and lowest trap win rates compared to 277, though the direction of the bias — which traps benefit — usually stays consistent with the sprint pattern.
Over 659 metres and beyond, the bias begins to wash out. Six bends provide enough positional variance that trap draw becomes a smaller component of the overall result. Stamina, racing intelligence and the ability to find a clean run through traffic matter more than the starting position. The statistical pattern may still show a slight lean toward certain traps, but the sample sizes are smaller (fewer staying races are scheduled) and the margin between the best and worst traps is narrower. According to the Scottish Animal Welfare Commission, racing greyhounds average approximately 65 km/h, and at that speed even small positional differences at the first bend compound through each subsequent turn — which is precisely why the effect is strongest over fewer bends and dilutes as more turns are added.
The practical lesson is to weight trap bias differently depending on the distance. At 277 metres, it should be one of the primary factors in your selection. At 462, it is important but not decisive. At 659 and above, it is background context — useful if two dogs are otherwise inseparable on form, but not a reliable standalone indicator. The racecard will tell you the distance; your job is to calibrate how much weight to give the trap number accordingly.
Sample Size and Seasonal Drift
Trap bias data is only as reliable as the sample that produced it. A win rate calculated from 50 races is noisy — subject to the randomness of a few lucky breaks or a cluster of fast dogs drawn in the same trap. A win rate calculated from 500 races at the same distance is far more stable and far more useful. Before acting on any trap statistics, check how many races are included in the dataset. As a rough guide, you need at least 200 races per distance to start treating the percentages as meaningful, and even then the margins between traps may not be statistically significant.
Seasonal drift is the less obvious complication. Track conditions change throughout the year: summer evenings produce faster, drier surfaces; winter brings heavier going and wind. At a coastal venue like Yarmouth, where the North Sea sits just a couple of hundred metres from the track, weather effects are more pronounced than at inland stadiums. Rain softens the sand surface, which can alter how dogs grip through the bends and shift the optimal racing line. A trap that dominates on fast ground in July may lose its edge on heavy going in January, because the surface dynamics through the turns change.
Track maintenance also plays a role. Resurfacing, drainage work or adjustments to the bend camber can subtly alter the geometry that drives trap bias. These changes do not happen often, but when they do, historical trap data from before the work may no longer apply. The best practice is to use rolling data — the most recent three to six months rather than a full year — and to update your assumptions as new results come in. Trap bias is persistent, but it is not permanent, and treating it as a fixed truth rather than a live variable is a mistake that costs money over time.